Training classifiers with HistomicsML2
This page describes how to use the HistomicsML2 interface to train classification rules using the example data provided in the Docker container.
A video tutorial of this content is available here:
Initializing the classifier
Go to http://localhost/HistomicsML/.
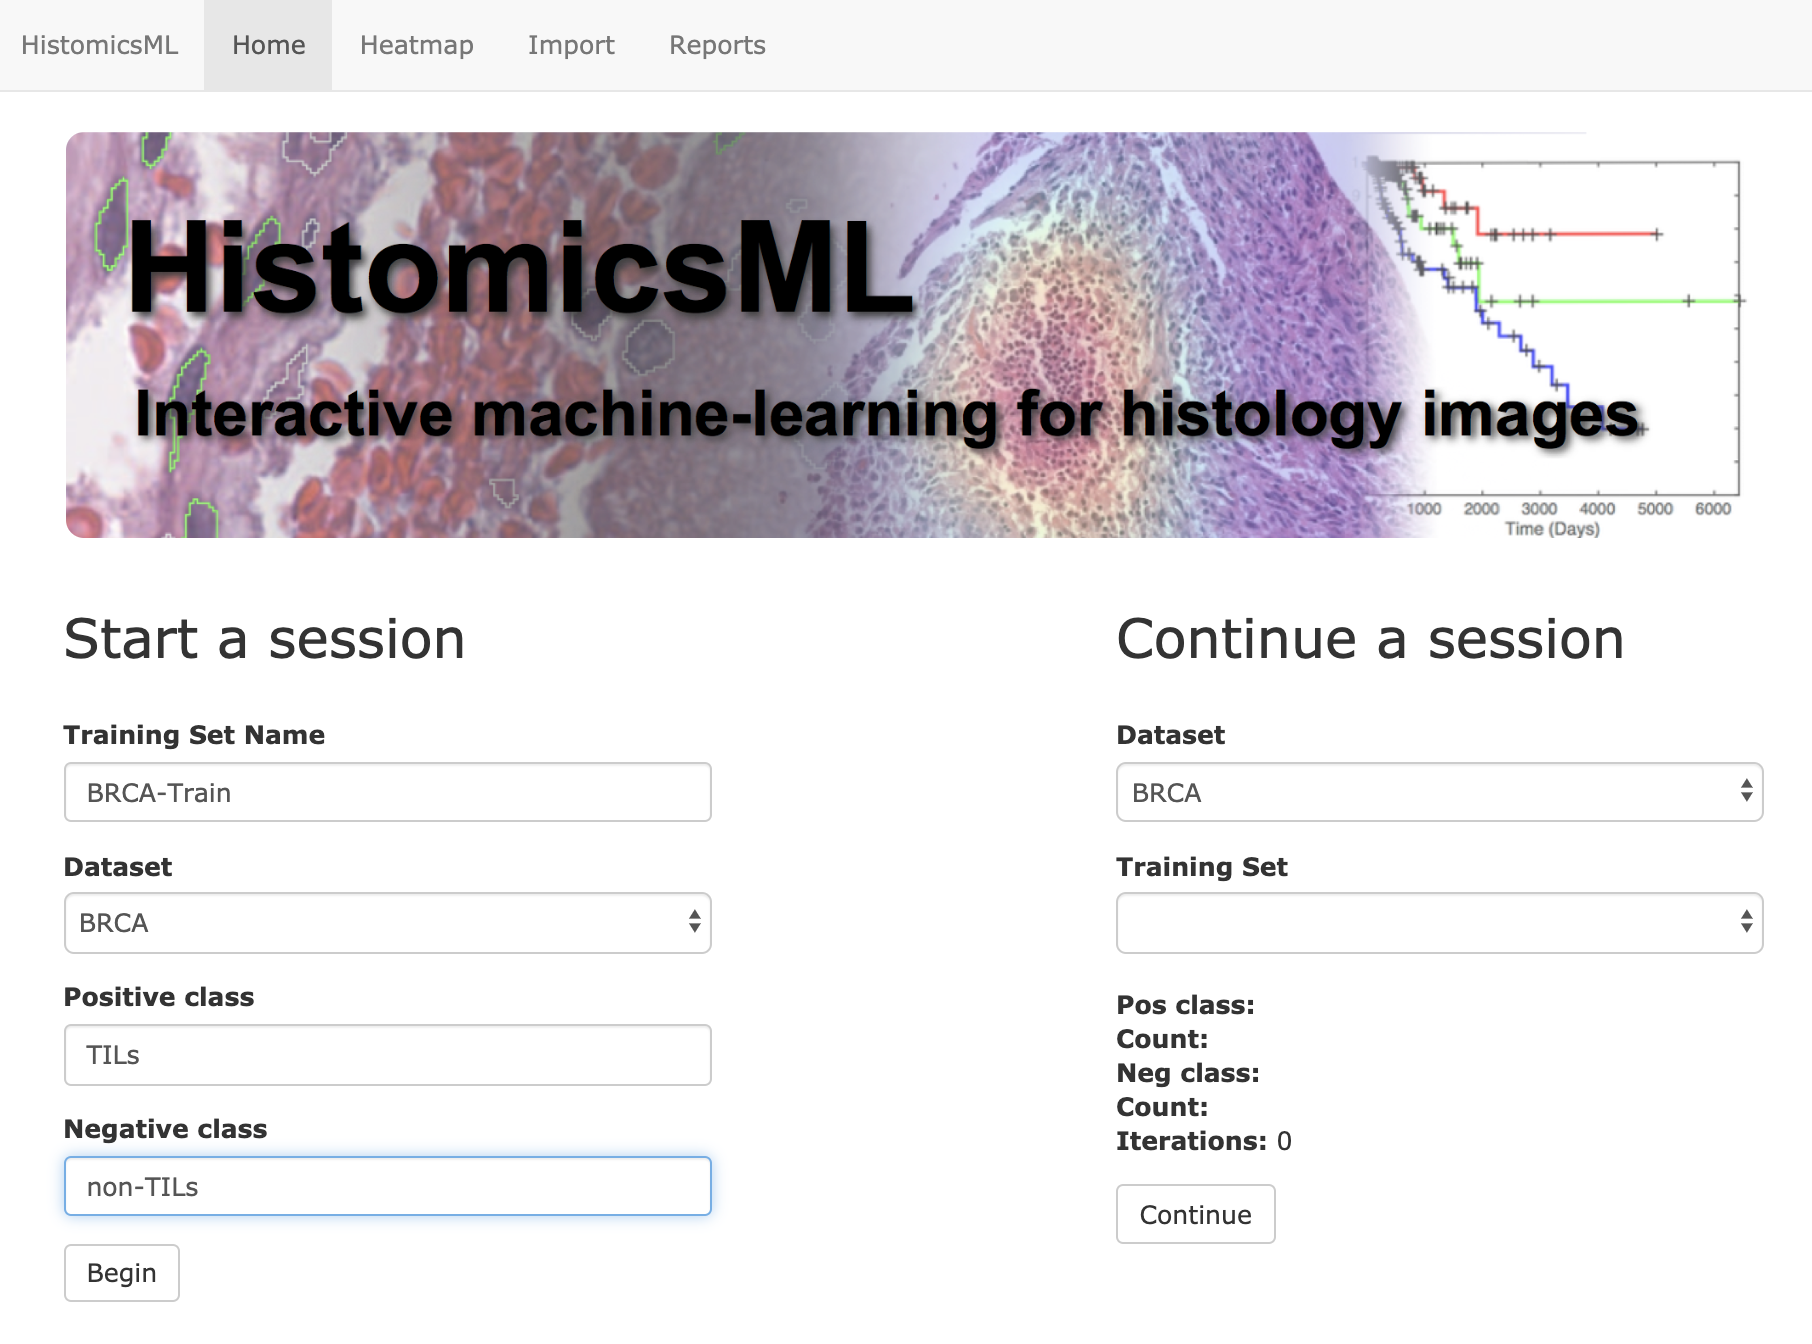
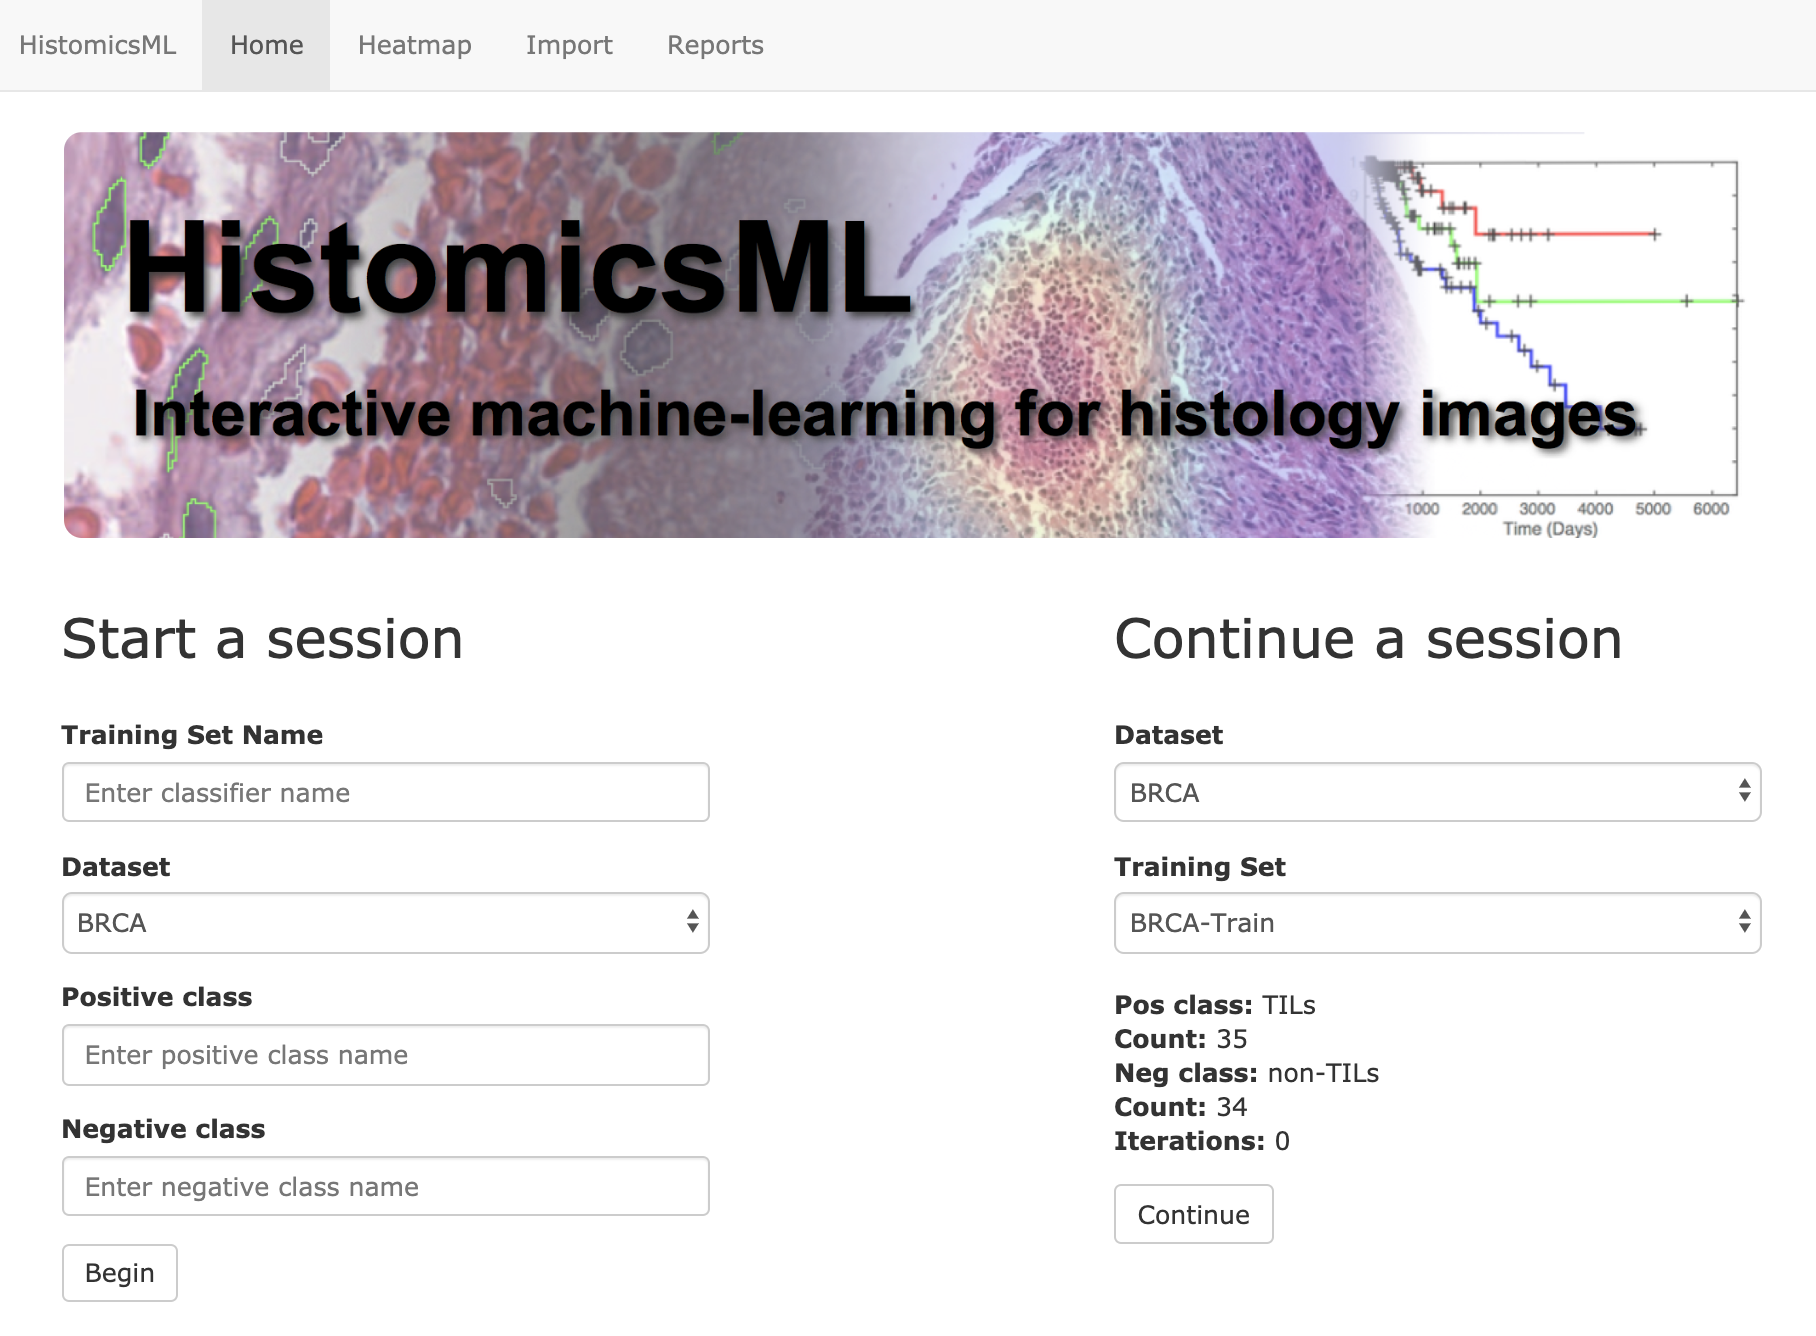
Under Start a session enter a training set name and select the pre-loaded The Cancer Genome Atlas Breast Invasive Carcinoma (TCGA-BRCA) dataset from the drop-down menu. Enter names for your classes - in our case we will follow the example of our paper use TILs for the positive class and non-TILs for the negative class.
After clicking Begin the Prime interface will be loaded to collect annotations in order to initialize the classifier. The drop-down can be used to select a slides to display in the slide viewer. Zoom to a region of interest in the slide, then click Show Segmentation to display object boundaries. After clicking Select Superpixels, you will be prompted to select four objects from each class. Double-clicking an object in the slide viewer will add this object to the training set, and display a thumbnail image of the object above the slide viewer.
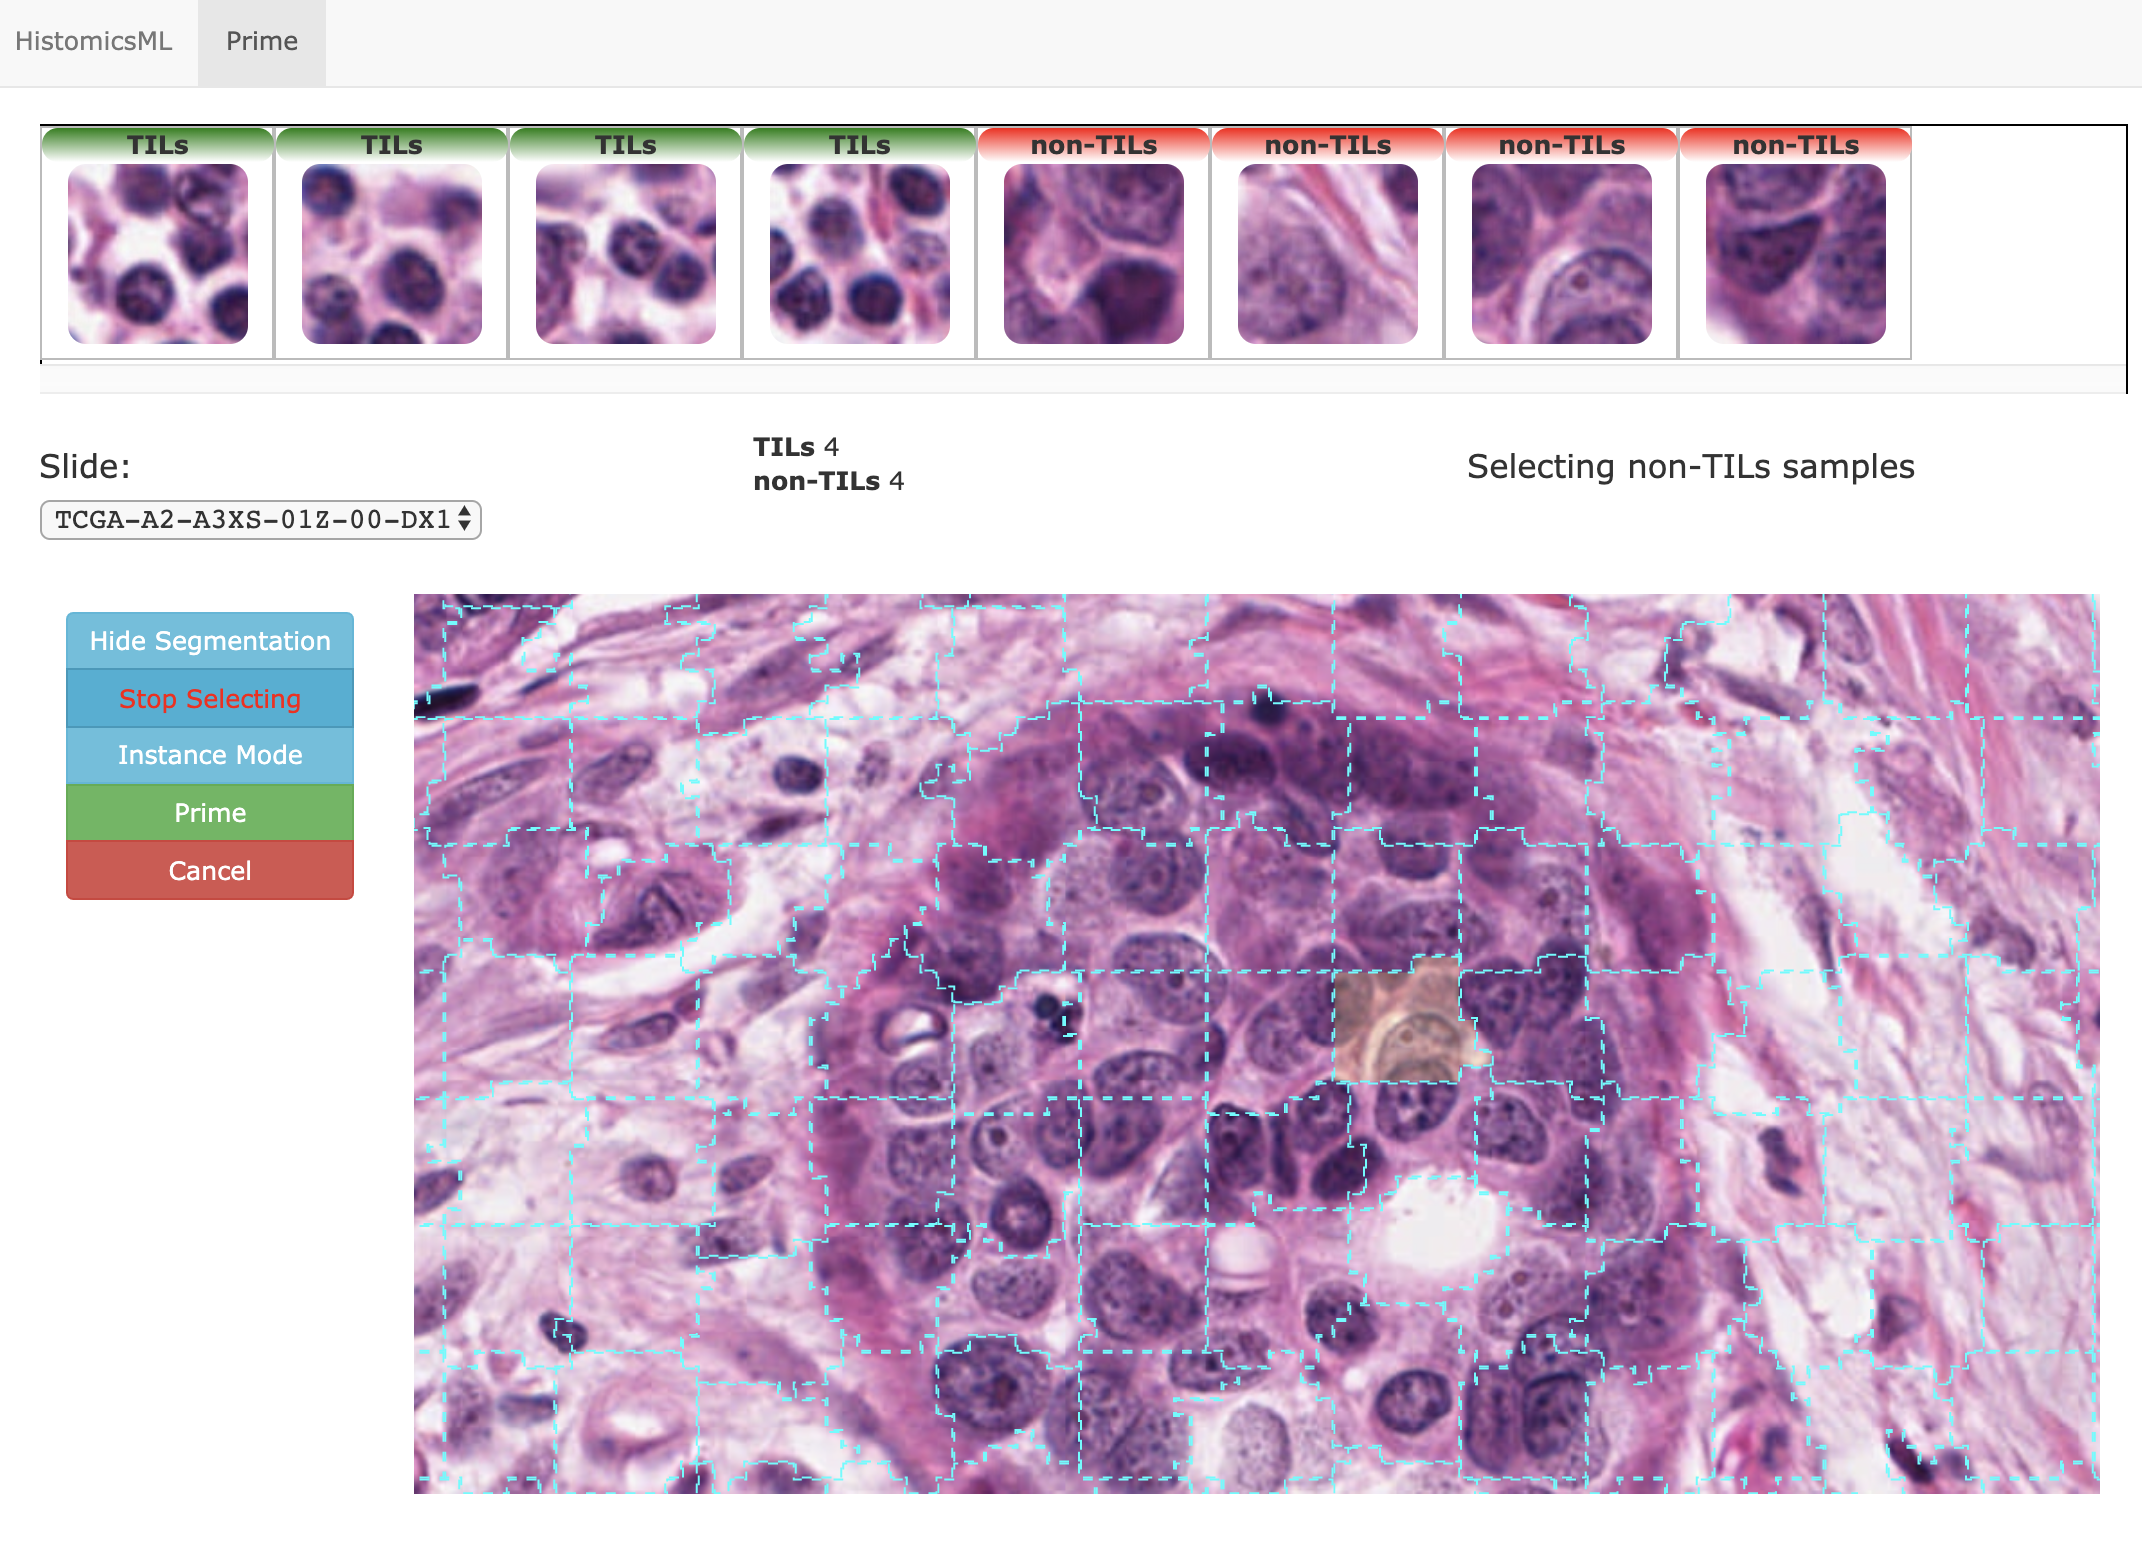
We selected 4 examples of positive superpixels and 4 examples of negative superpixels in this example.
Note
You can remove objects from the training set in this menu by double clicking their thumbnail images.
With the initial annotation complete, click Prime to create the classifier. There will be a small delay while the classifier is trained and applied to the entire dataset to generate predictions for active learning.
Heatmap-based active learning
The Gallery menu provides a high-level overview of the current classification results for the entire dataset. Each row displays heatmaps for a single slide - the left heatmap indicates the classifier uncertainty (red = more uncertain) - and the right heatmap indicates the positive class object density (red = higher density of positively classified objects). Slides are sorted in this view based on average uncertainty, with the slide having the most uncertaintly placed at the top.
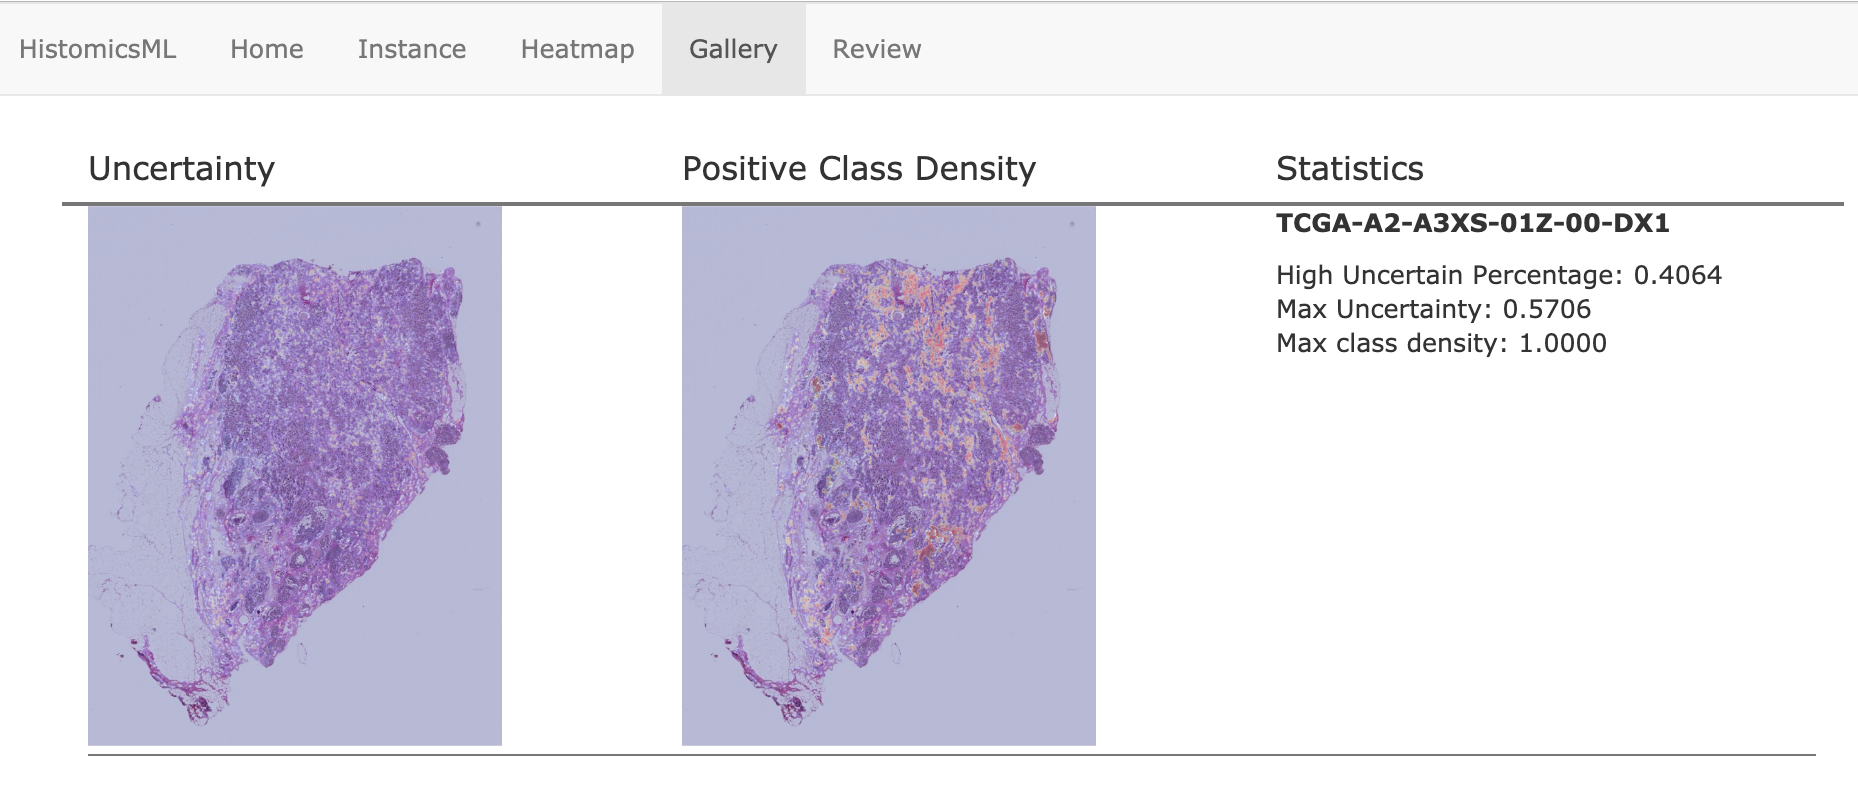
Clicking a slide in the gallery will load this slide in the heatmap viewer, where the user can identify regions for annotation. Clicking Show Segmentation will display the heatmap overlay on the slide viewer, and the user can zoom to hotspots to provide corrections to the classifier.
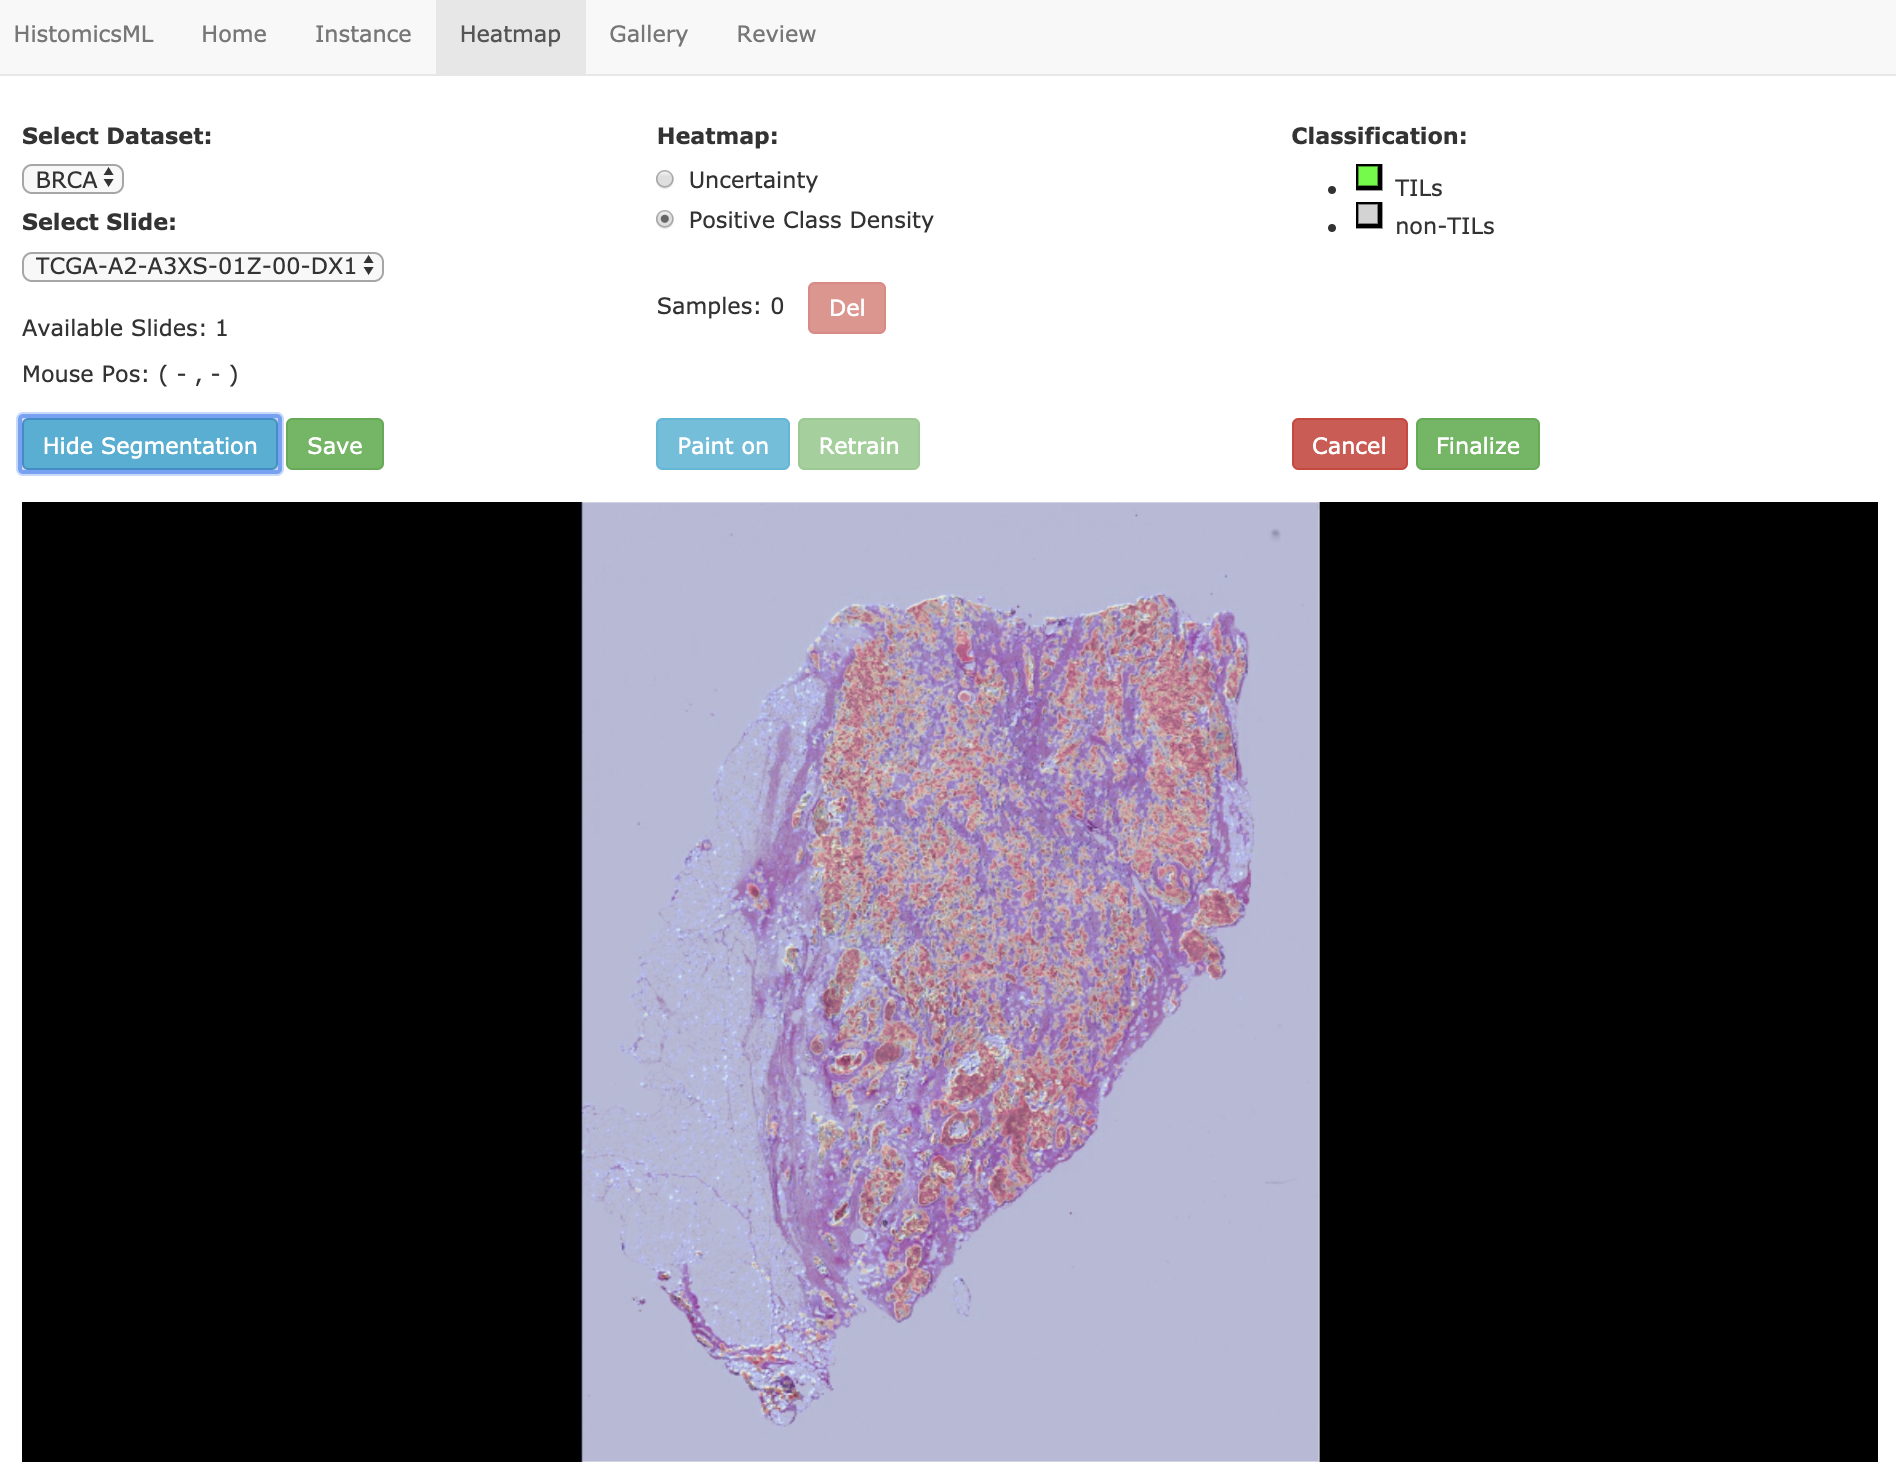
At high-magnification, objects are displayed with color-coded superpixels to indicate their predicted class (green = positive). Prediction errors can be corrected directly in the slide viewer by painting superpixels after clicking Paint on, adding this object to the training set. The classifier can be retrained with the Retrain button.
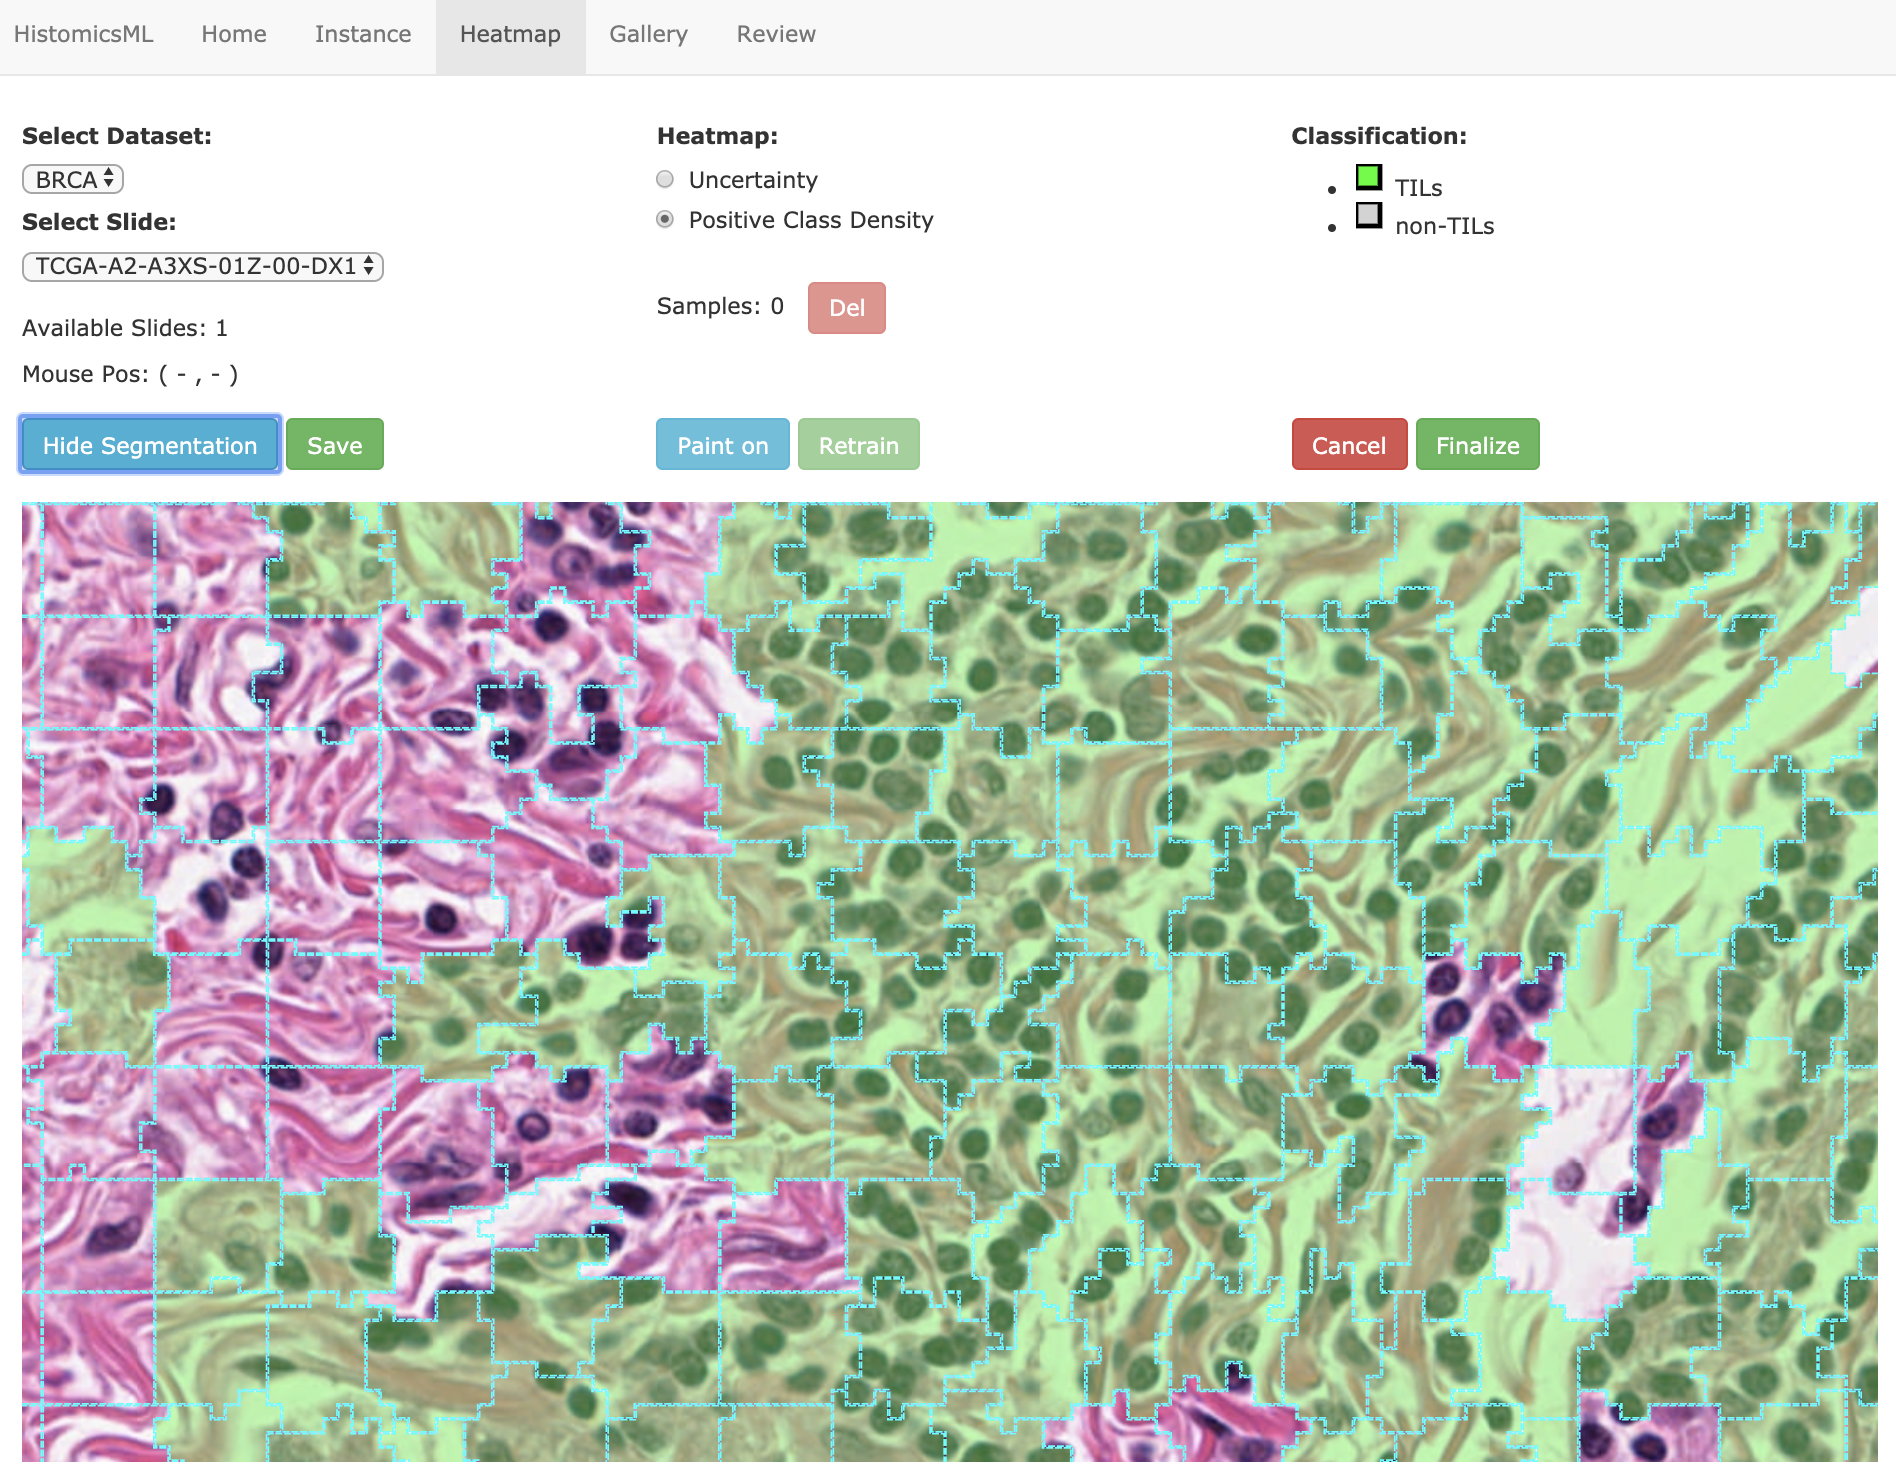
Note
Object labels can be cycled in the heatmap menu by a drag-drop function after selecting Paint On. An object can be removed from the training set by clicking Del
When the training is completed, click the Save or Finalize button to save the training set to the database. This training set can be reloaded and resumed from using the Continue a session option on the main page.
Reviewing a training set
Annotations in a validation set can be reviewed using the review interface.
At the home page under Continue a session, select the dataset and training set name and click Continue. Navigate to the Review interface by clicking the tab at the top menu.
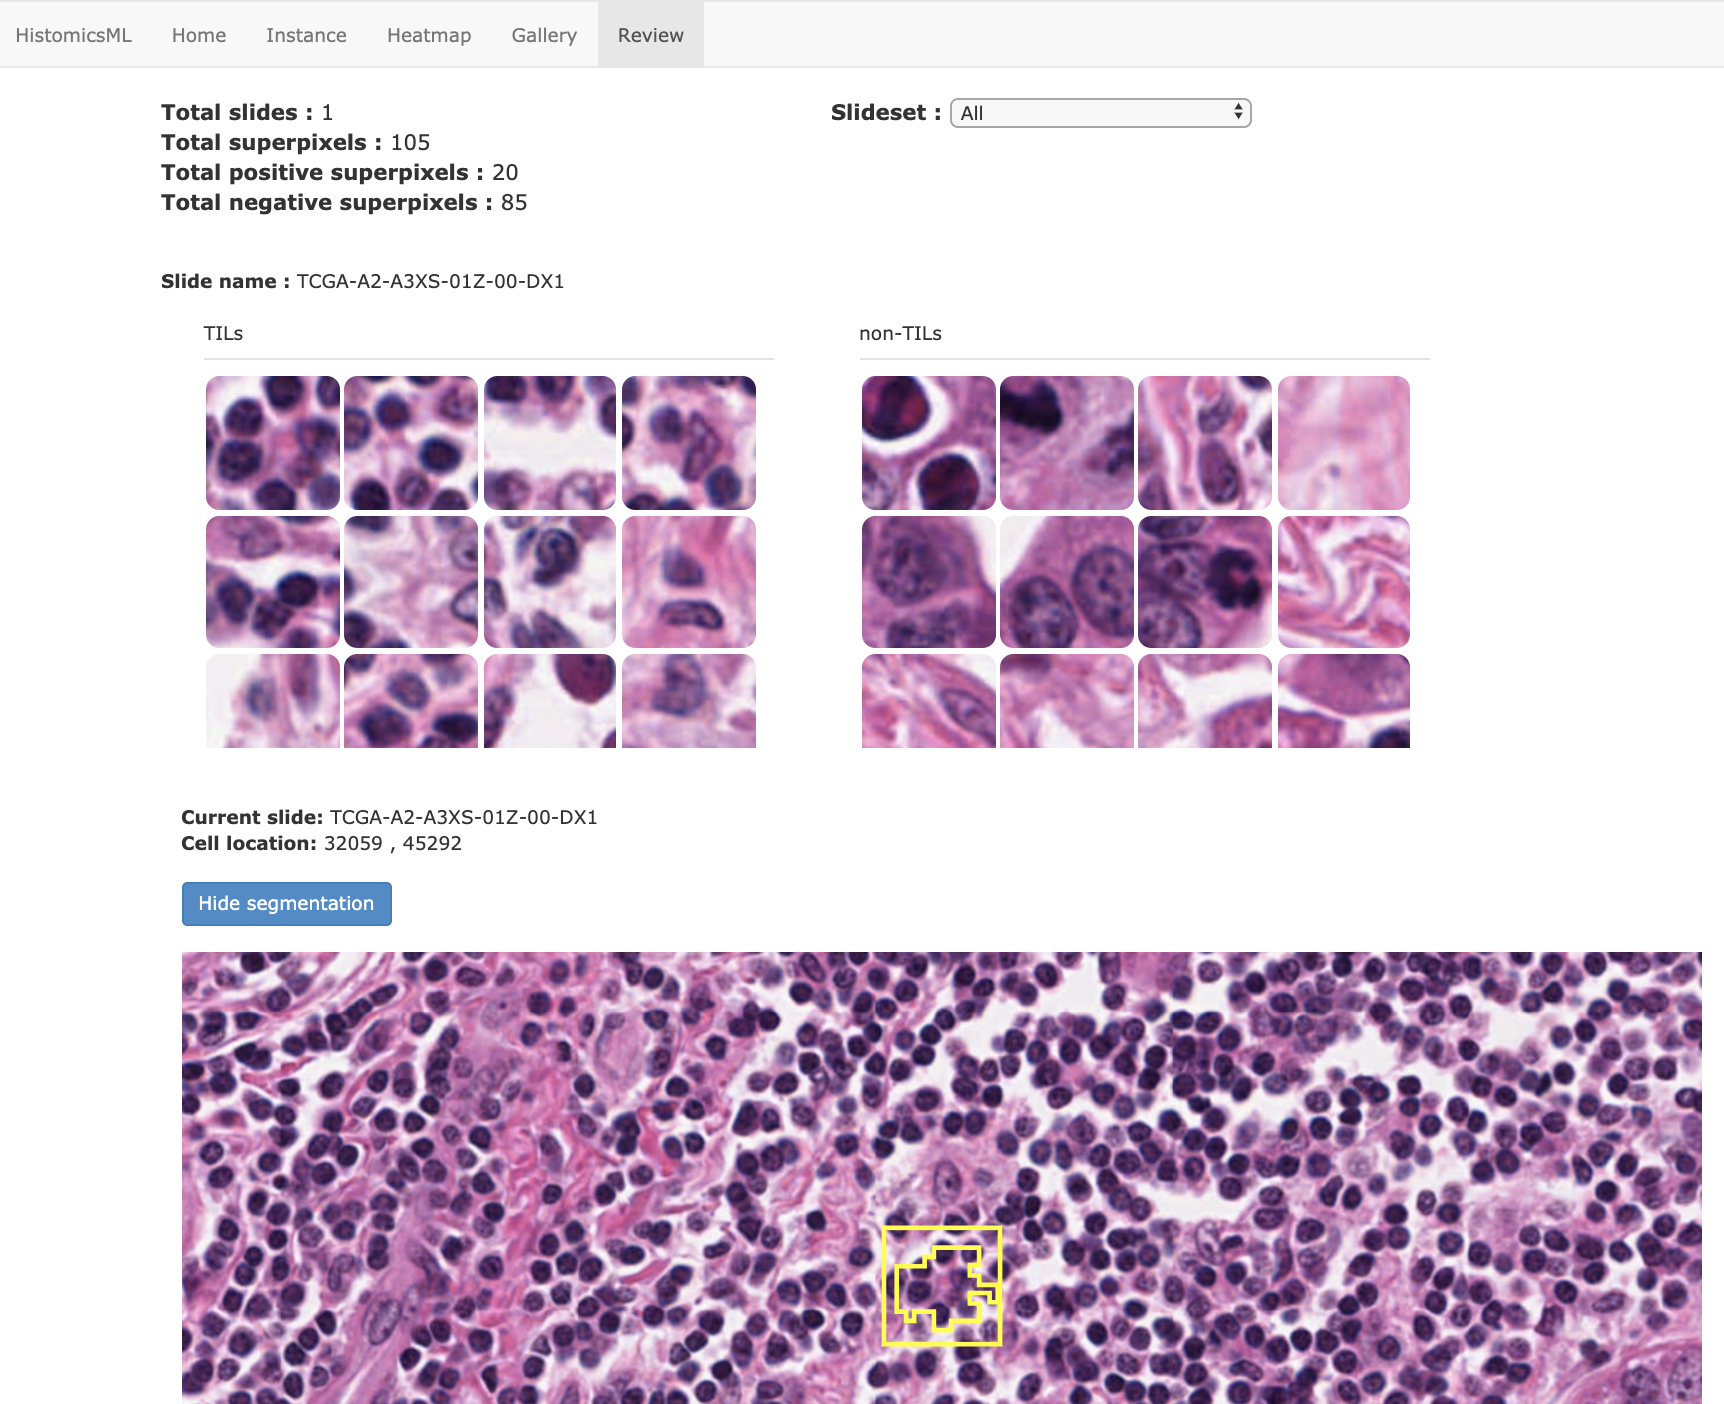
The review interface displays the annotated objects organized by class and slide. Thumbnail images of the objects are organized into columns by class. Clicking a thumbnail will bring that object into the field of view in the slide view. The thumbnails can be dragged/dropped to a different column to change the class label. Changes are instantly commited to the database (no additional button clicks are needed).